
Capabilities
What PrismLink accepts, how it decides where a value belongs, what it can compute, and how it is deployed.
Sources
- DICOM Structured Reports received over the network from ultrasound, DXA, CT post-processing and other structured-reporting modalities.
- HL7 ORU result messages received over MLLP, for departments whose structured data arrives as observation results rather than DICOM.
- Every received document is retained byte-for-byte in a content-addressed archive, with an append-only record of its status. The original is never modified.
Mapping
The same anatomical measurement is encoded differently by every manufacturer, and often differently between software versions of the same scanner. PrismLink treats device identity — modality, manufacturer, model and software version — as part of the mapping key, so a firmware upgrade that moves a value cannot silently redirect it into the wrong field.
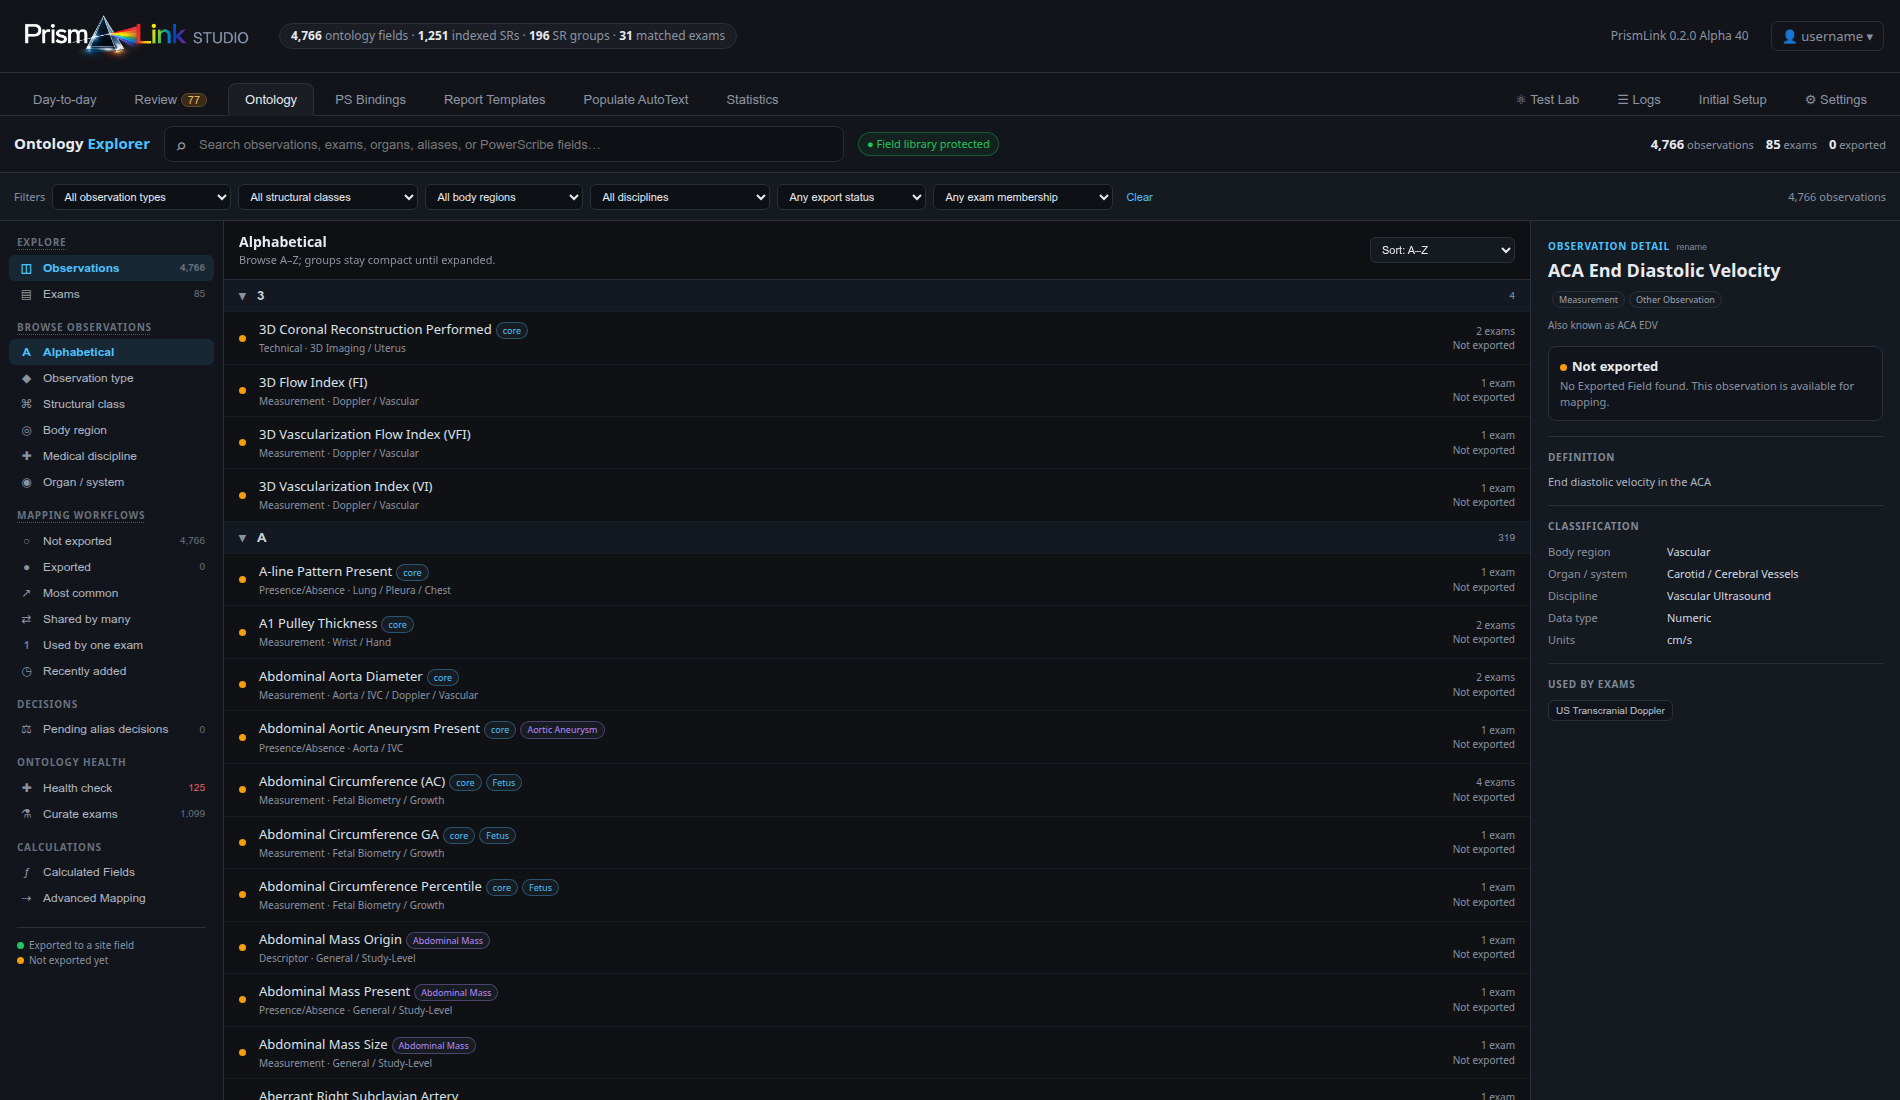
- Clinical field ontology. A curated catalogue of report fields per exam type, versioned, with units, data types and permitted values.
- Per-device mapping. Each device's encoding is mapped to that ontology once, reviewed, and then applied to every subsequent study from that device.
- Repeatable findings. Measurements that occur per fetus, per lesion or per follicle stay attached to the specific fetus, lesion or follicle they were taken from, all the way to the report. A measurement that cannot be confidently attached is left out rather than guessed.
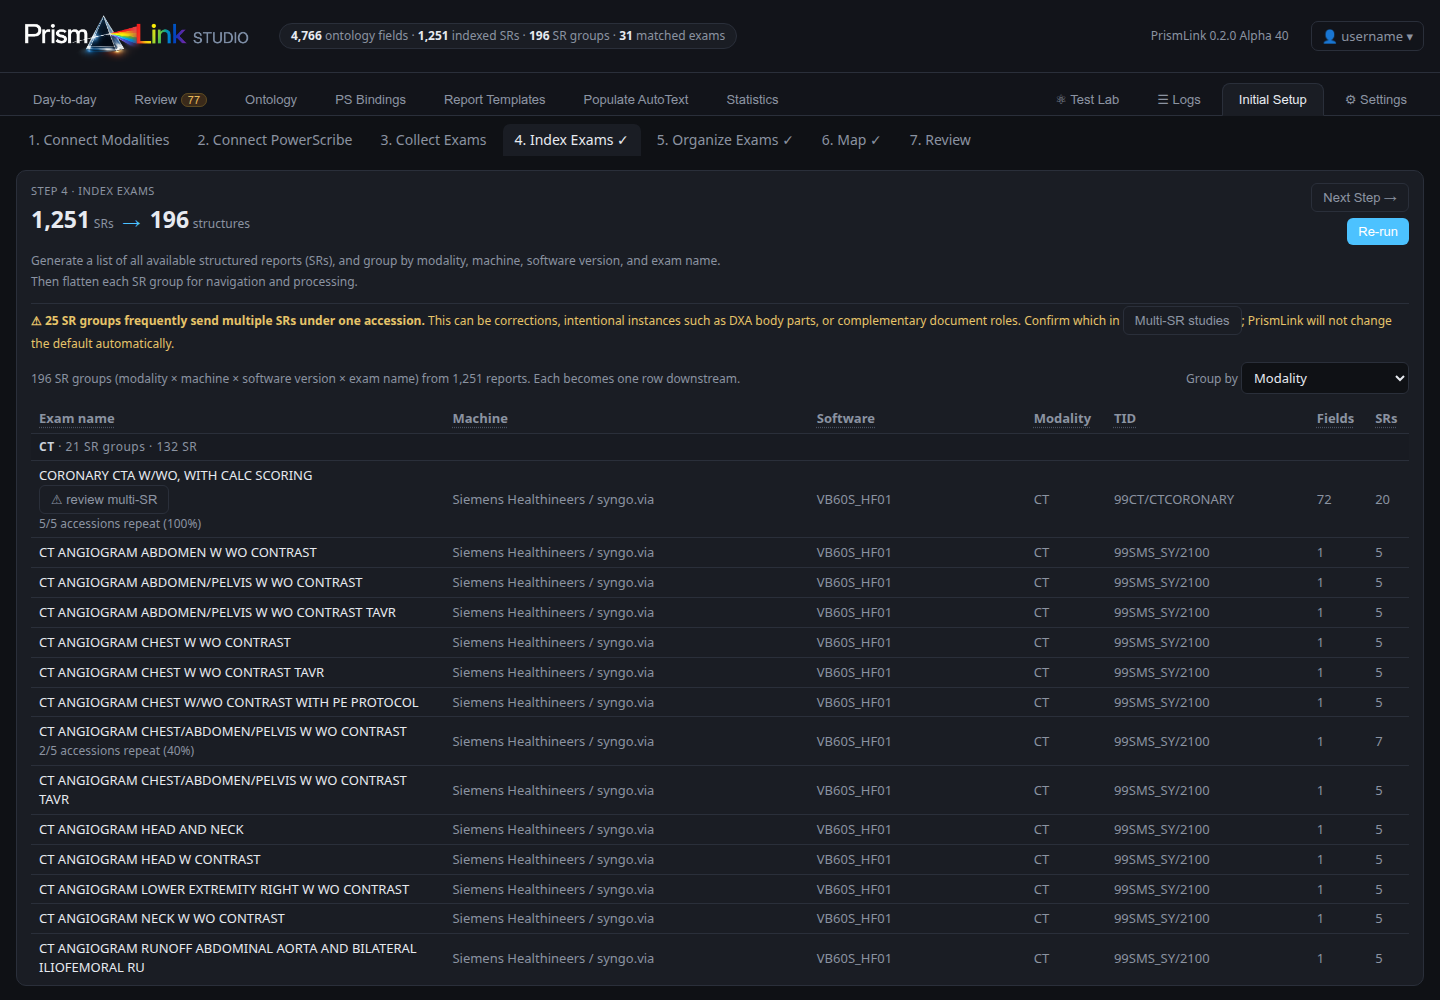
- Several documents, one exam. Where a single accession produces multiple structured reports, a person reviews how those documents relate — a correction, a separate reading, or a companion document — and that decision controls how they are combined, delivered and audited. A document whose role has not been decided is held rather than quietly merged.
- Prior and repeated observations. Where a source records several observations of the same measurement — priors, repeated scans — the mapping chooses among them using a short, fixed list of rules selected during setup: earliest or latest by date, first or last in the document, smallest, largest or average. If no rule was chosen, or the right choice is unclear, the field is left empty.
Transformation
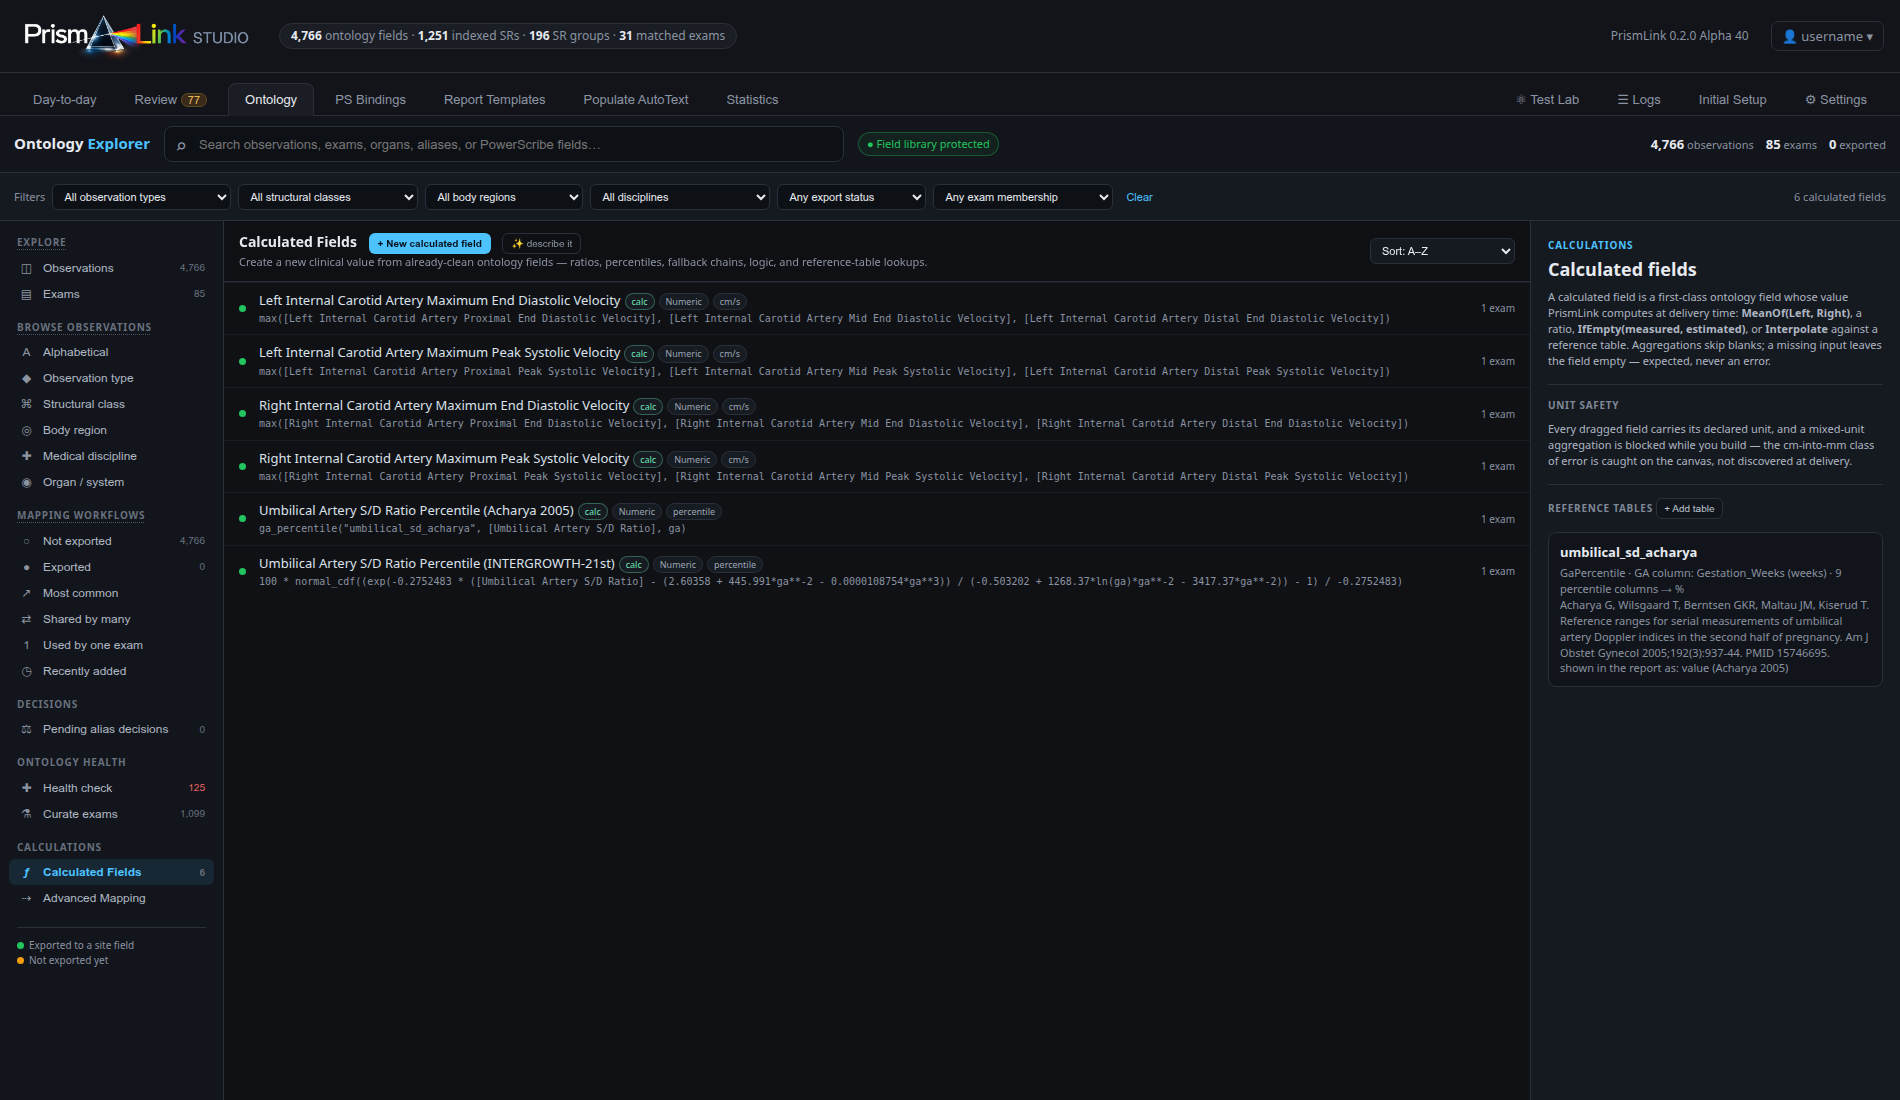
- Unit conversion between declared source and destination units, with per-field overrides.
- Site formatting — rounding, precision and presentation, configured once and applied consistently.
- Calculated fields authored in the browser from a closed, audited set of operations: arithmetic, typed conditional logic, and lookups against published clinical reference tables such as gestational-age percentile curves.
- Bounded values (
<3%) retain their comparator as data rather than being silently rounded to the threshold.
Delivery
- Values are written into the reporting system as discrete custom report fields.
- A durable spool tracks every delivery attempt through to acknowledgement, with failed sends retained for inspection rather than discarded.
- A correction that removes a previously delivered value emits an explicit clear, so a stale number cannot persist in the report.
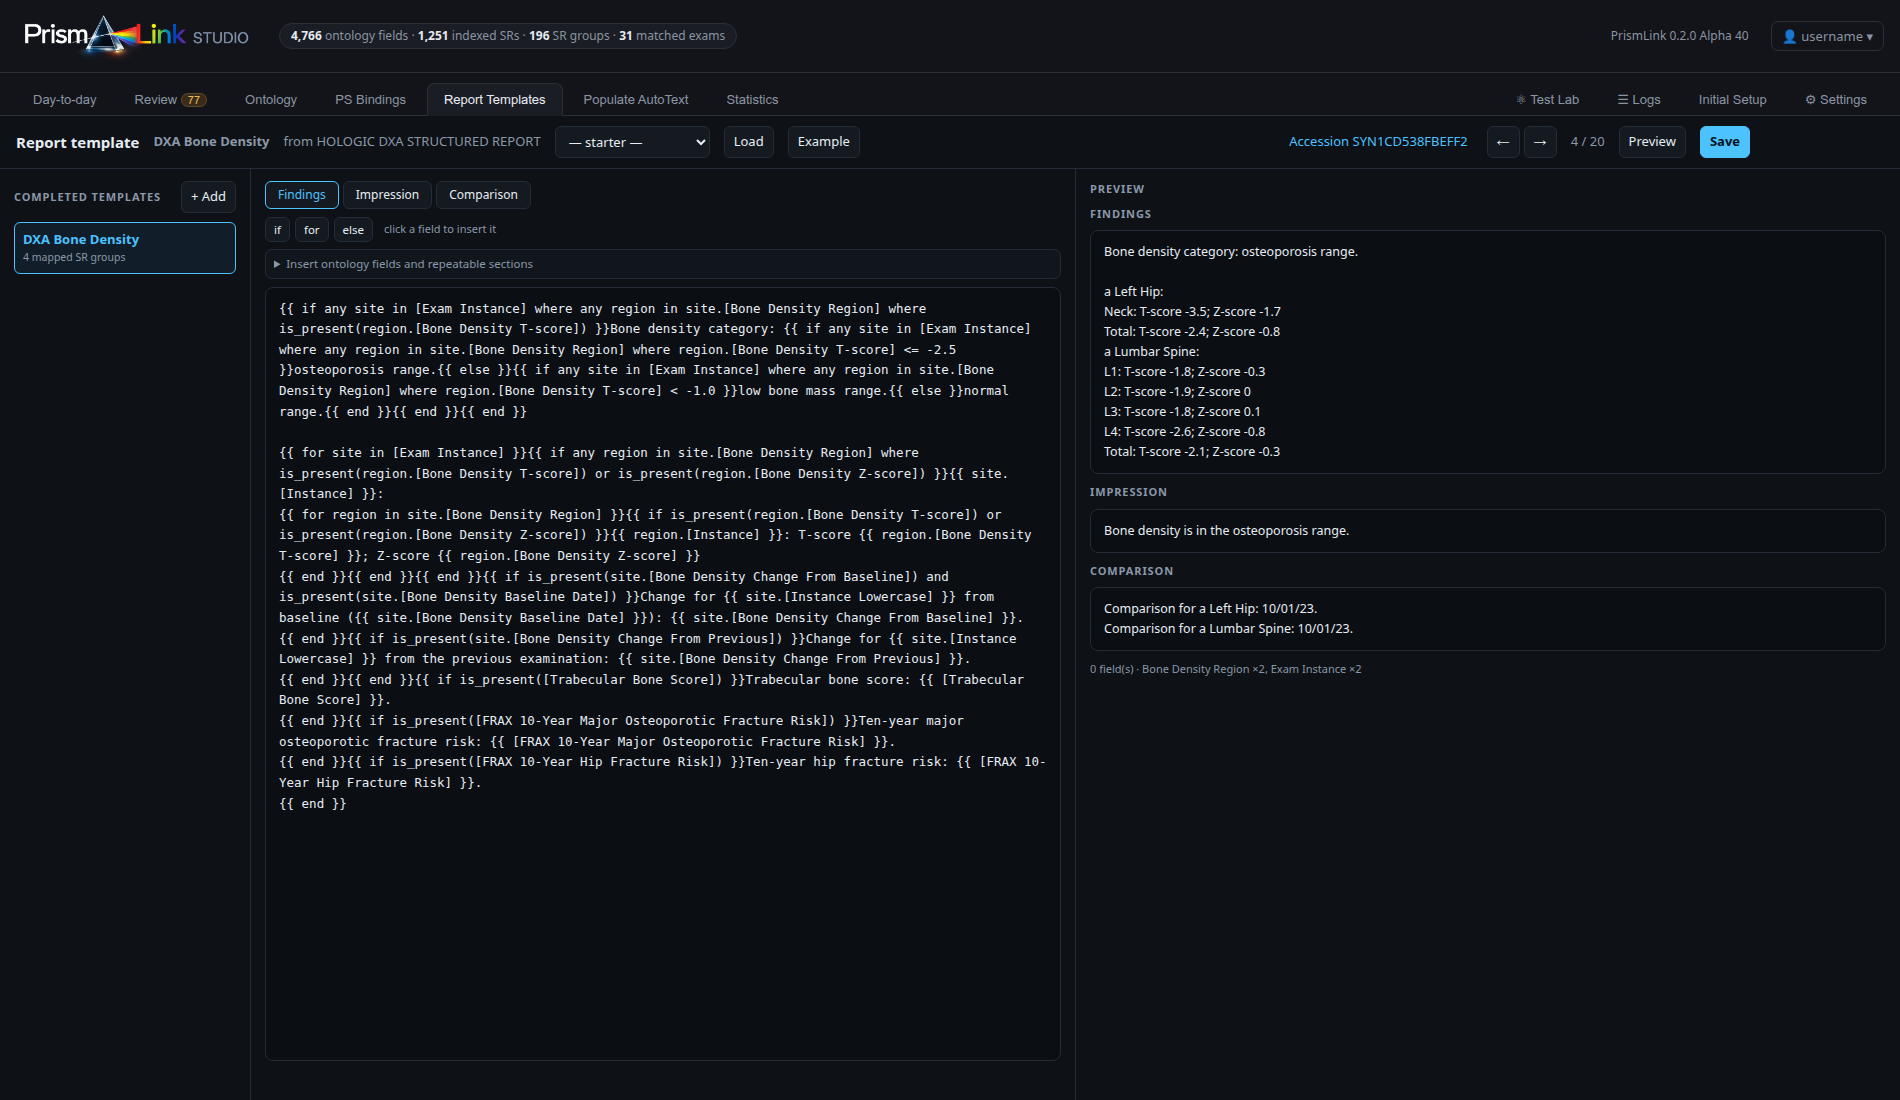
Where a site wants narrative as well as discrete fields, a report template turns the mapped values into report text — findings, impression, comparison — with loops over repeated regions and lines that drop out when a value is missing, previewed against real studies before use.
Configuration
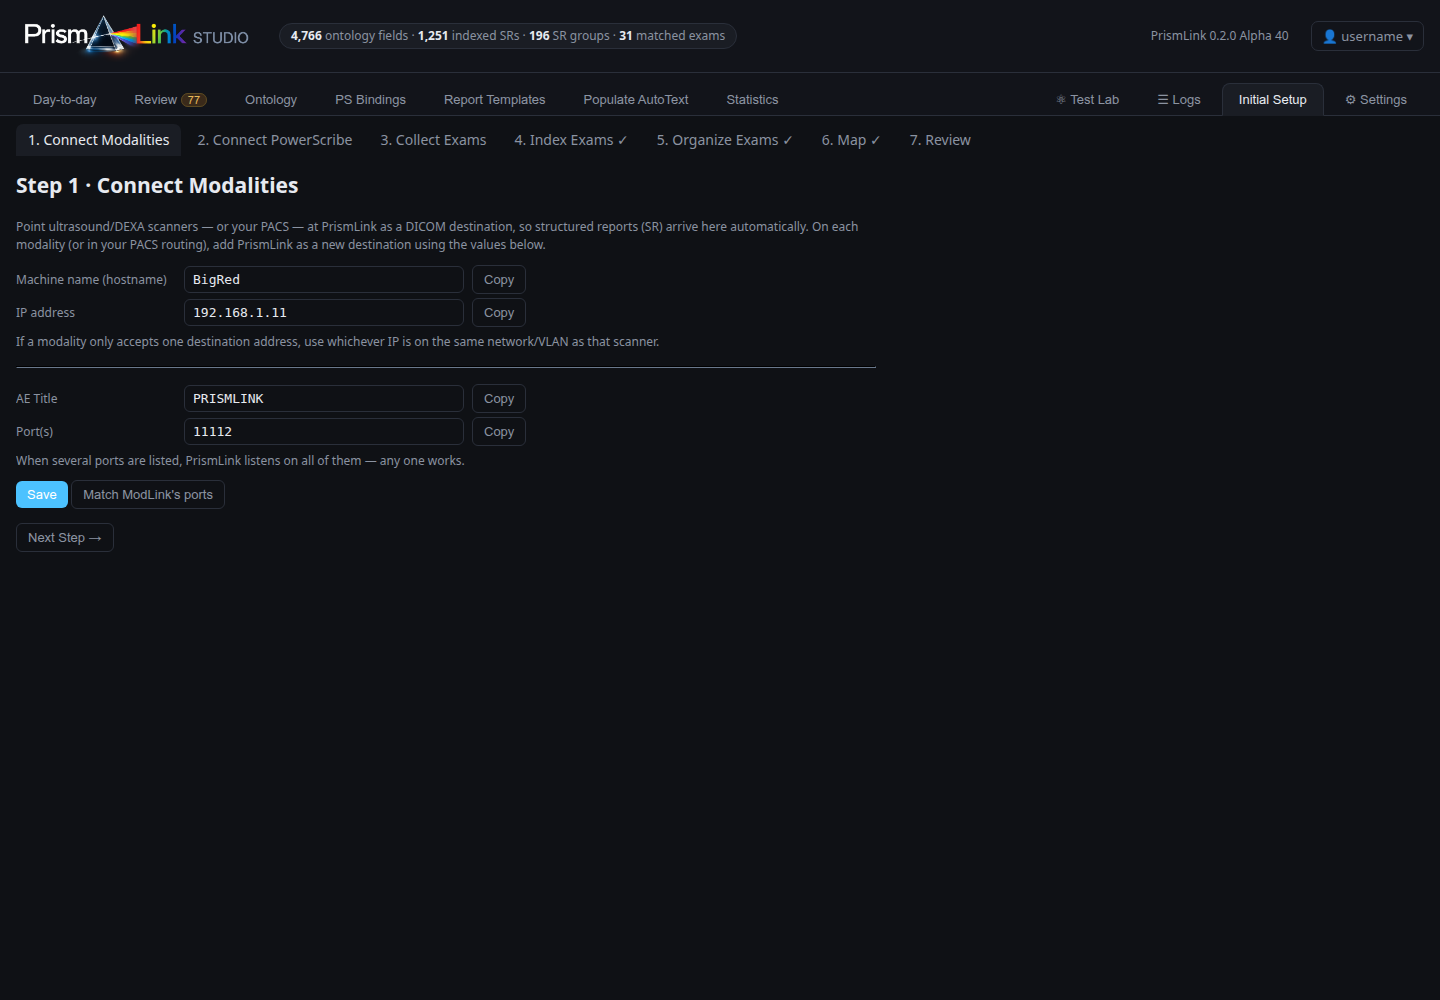
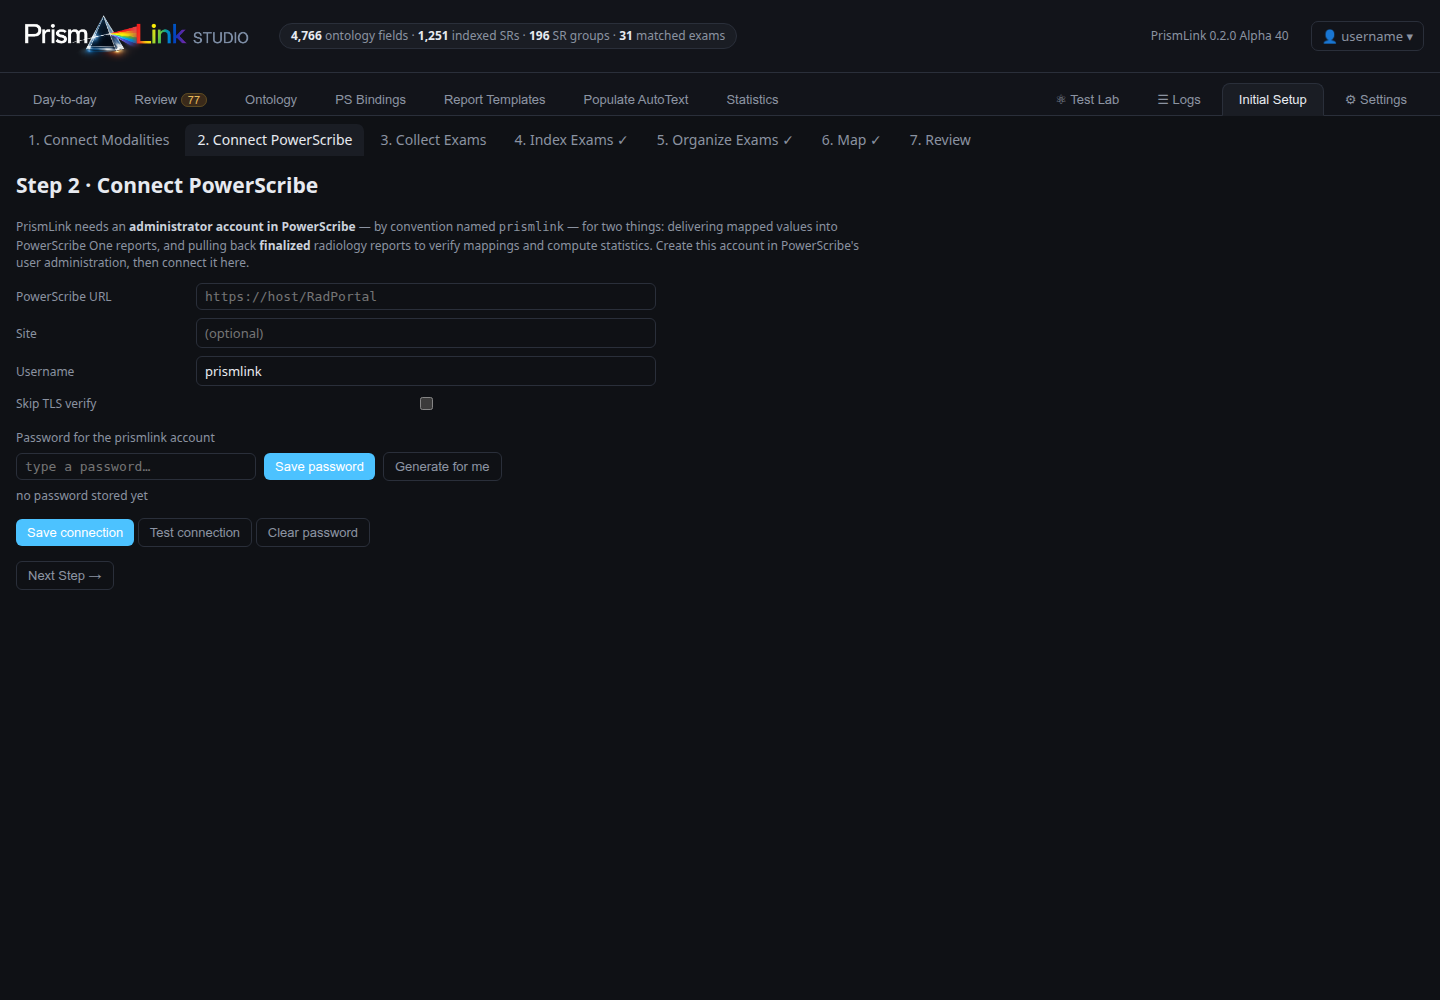
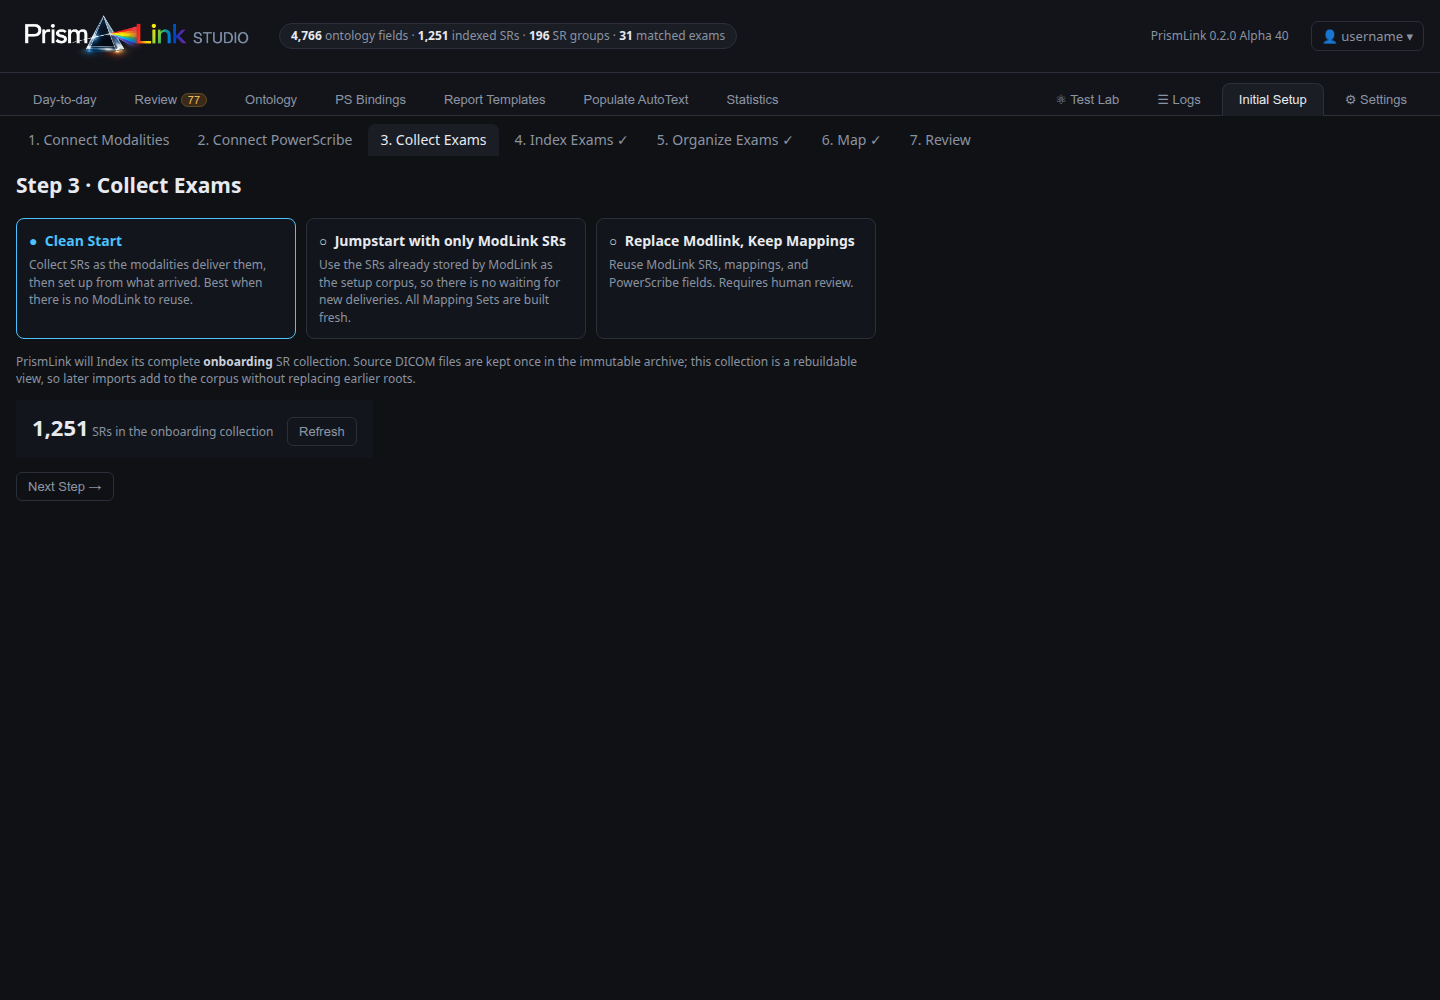
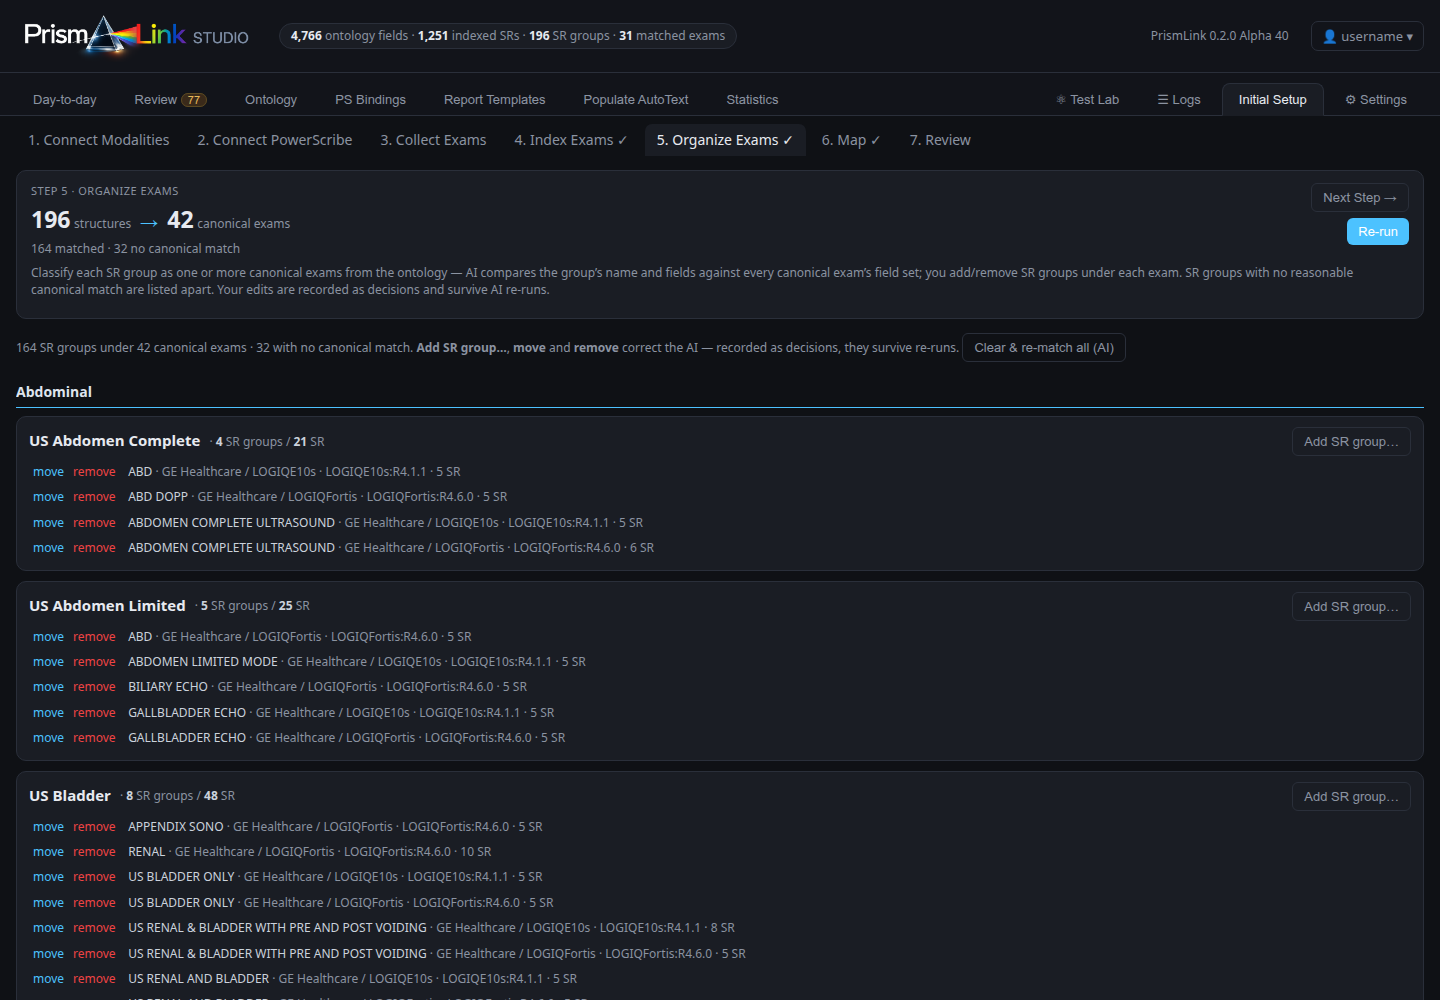
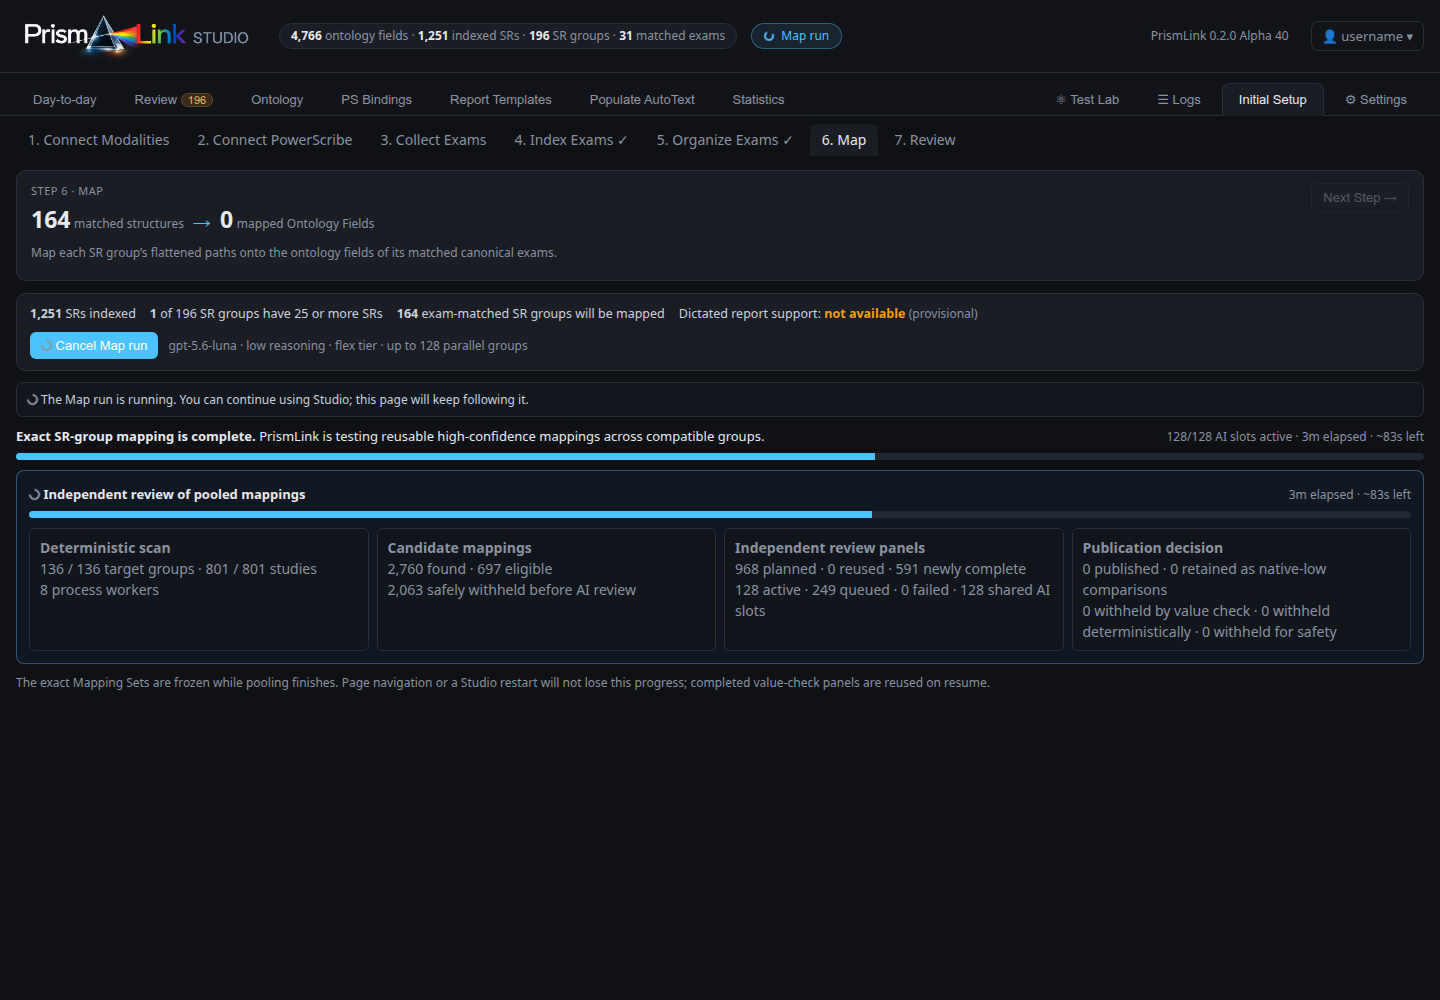
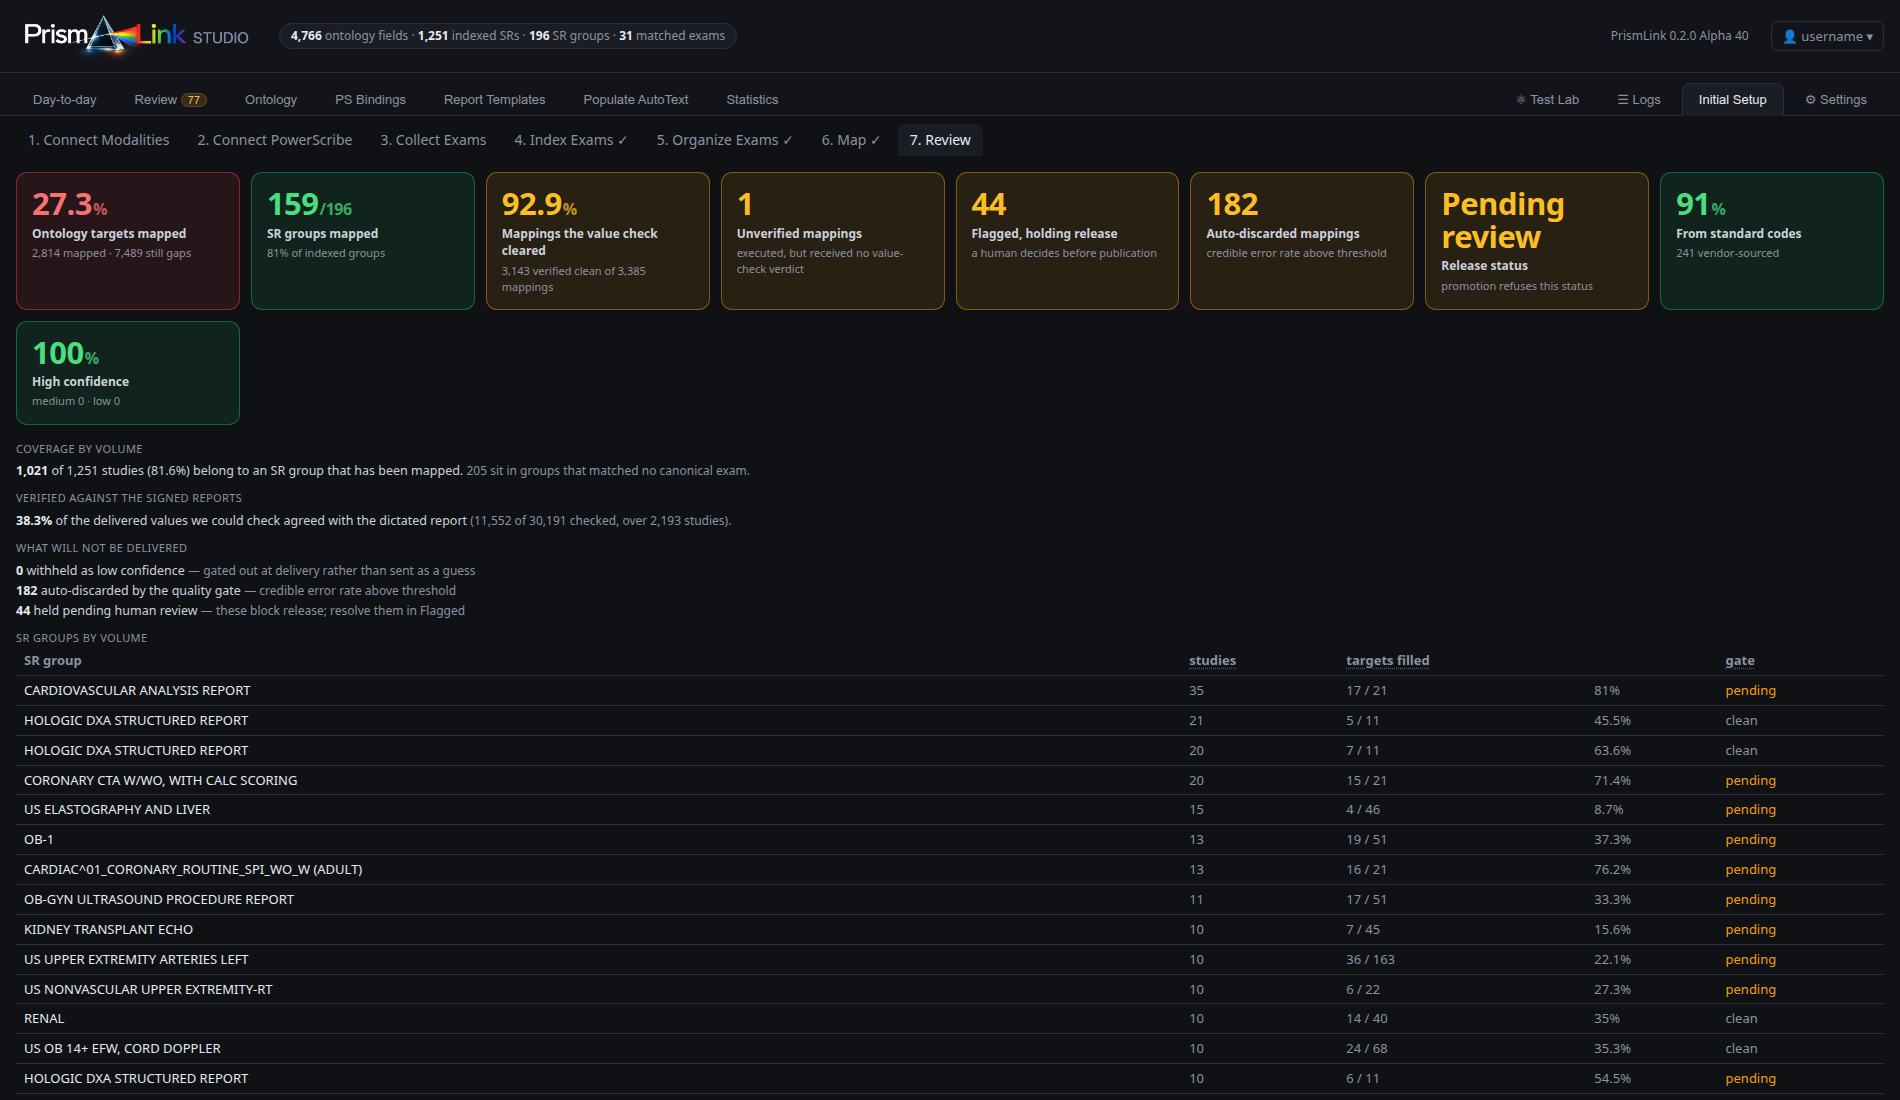
PrismLink is configured through PrismLink Studio™, a browser interface served locally by the application. Setup walks through connecting modalities and the reporting system, indexing the exams a site actually performs, organising them, mapping them, and reviewing the result before anything goes live.
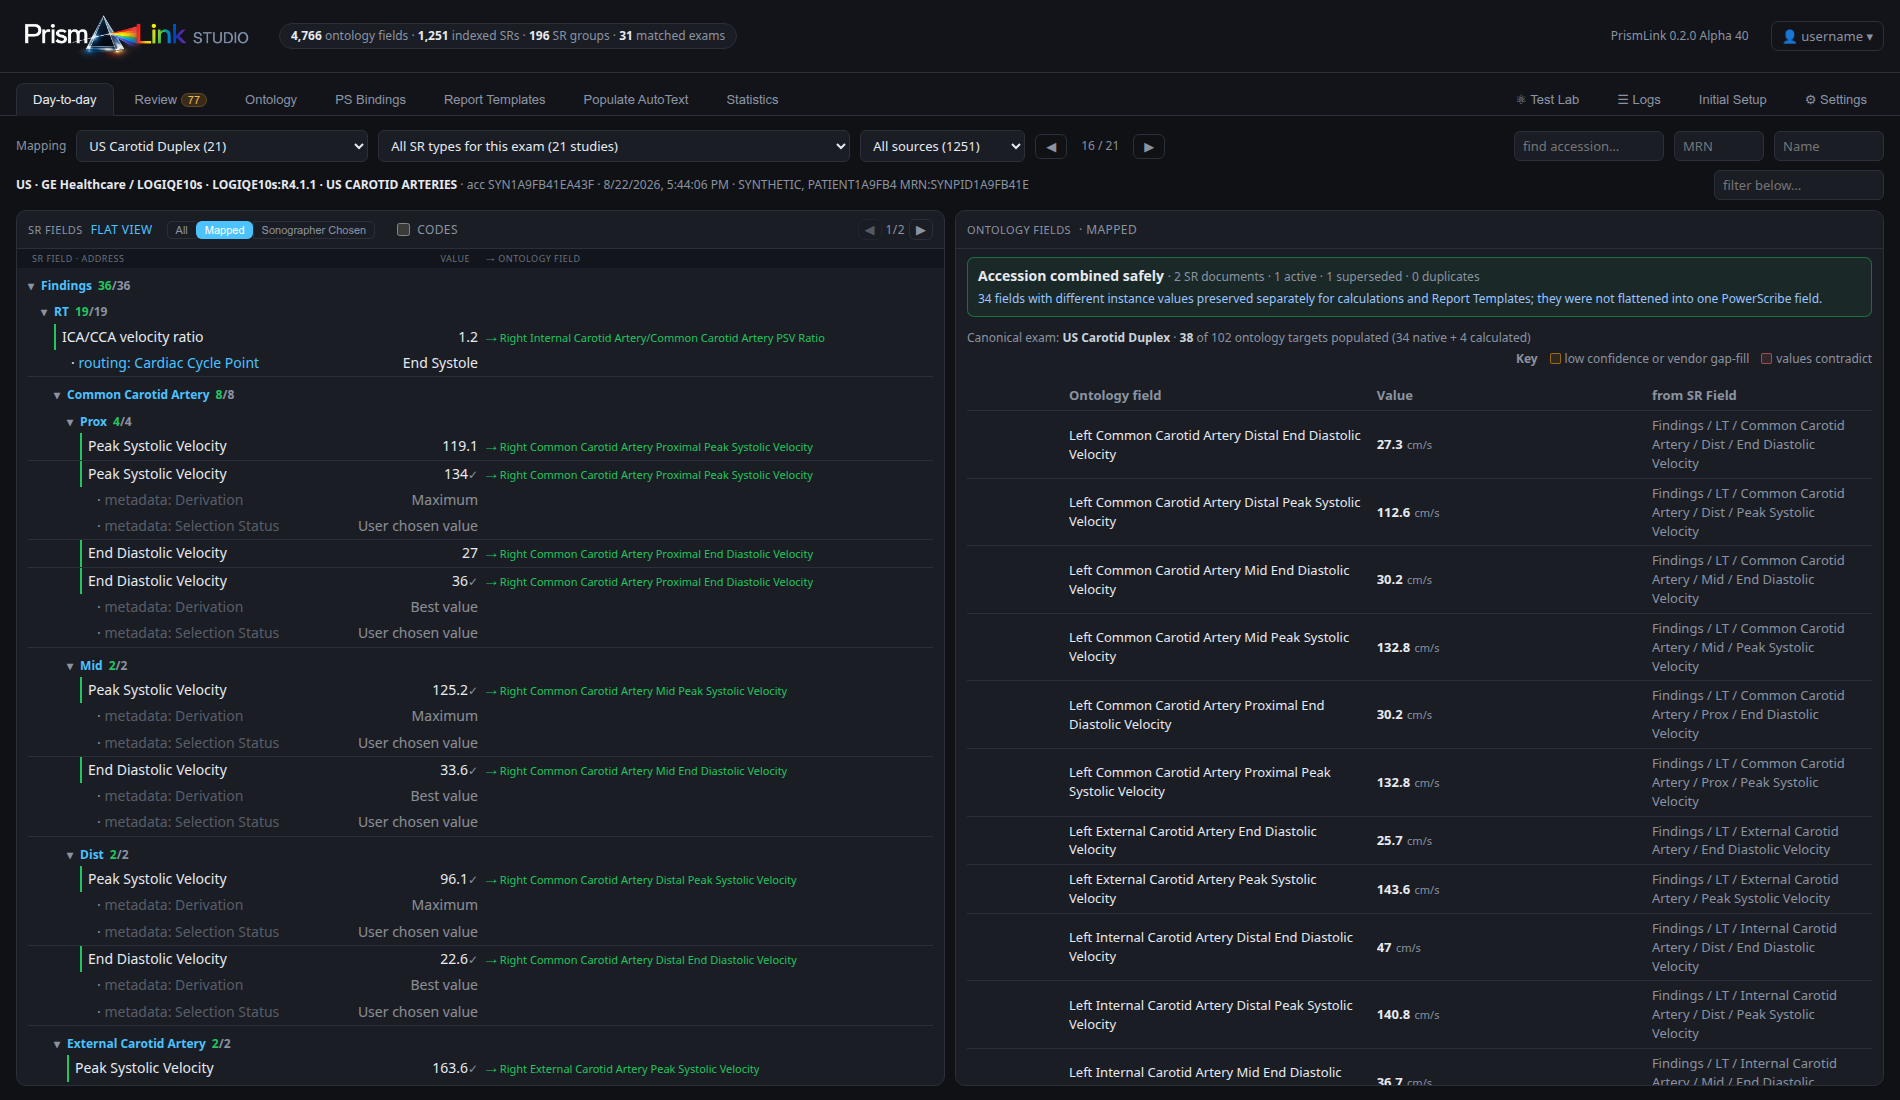
Day-to-day, Studio shows any received study side by side with what PrismLink extracted from it — the full structured source on one side, the mapped report fields on the other — so a mapping can be inspected against the study that produced it. Studies can be found by accession, patient name or record number through a private local index; newly received studies appear in the view automatically.
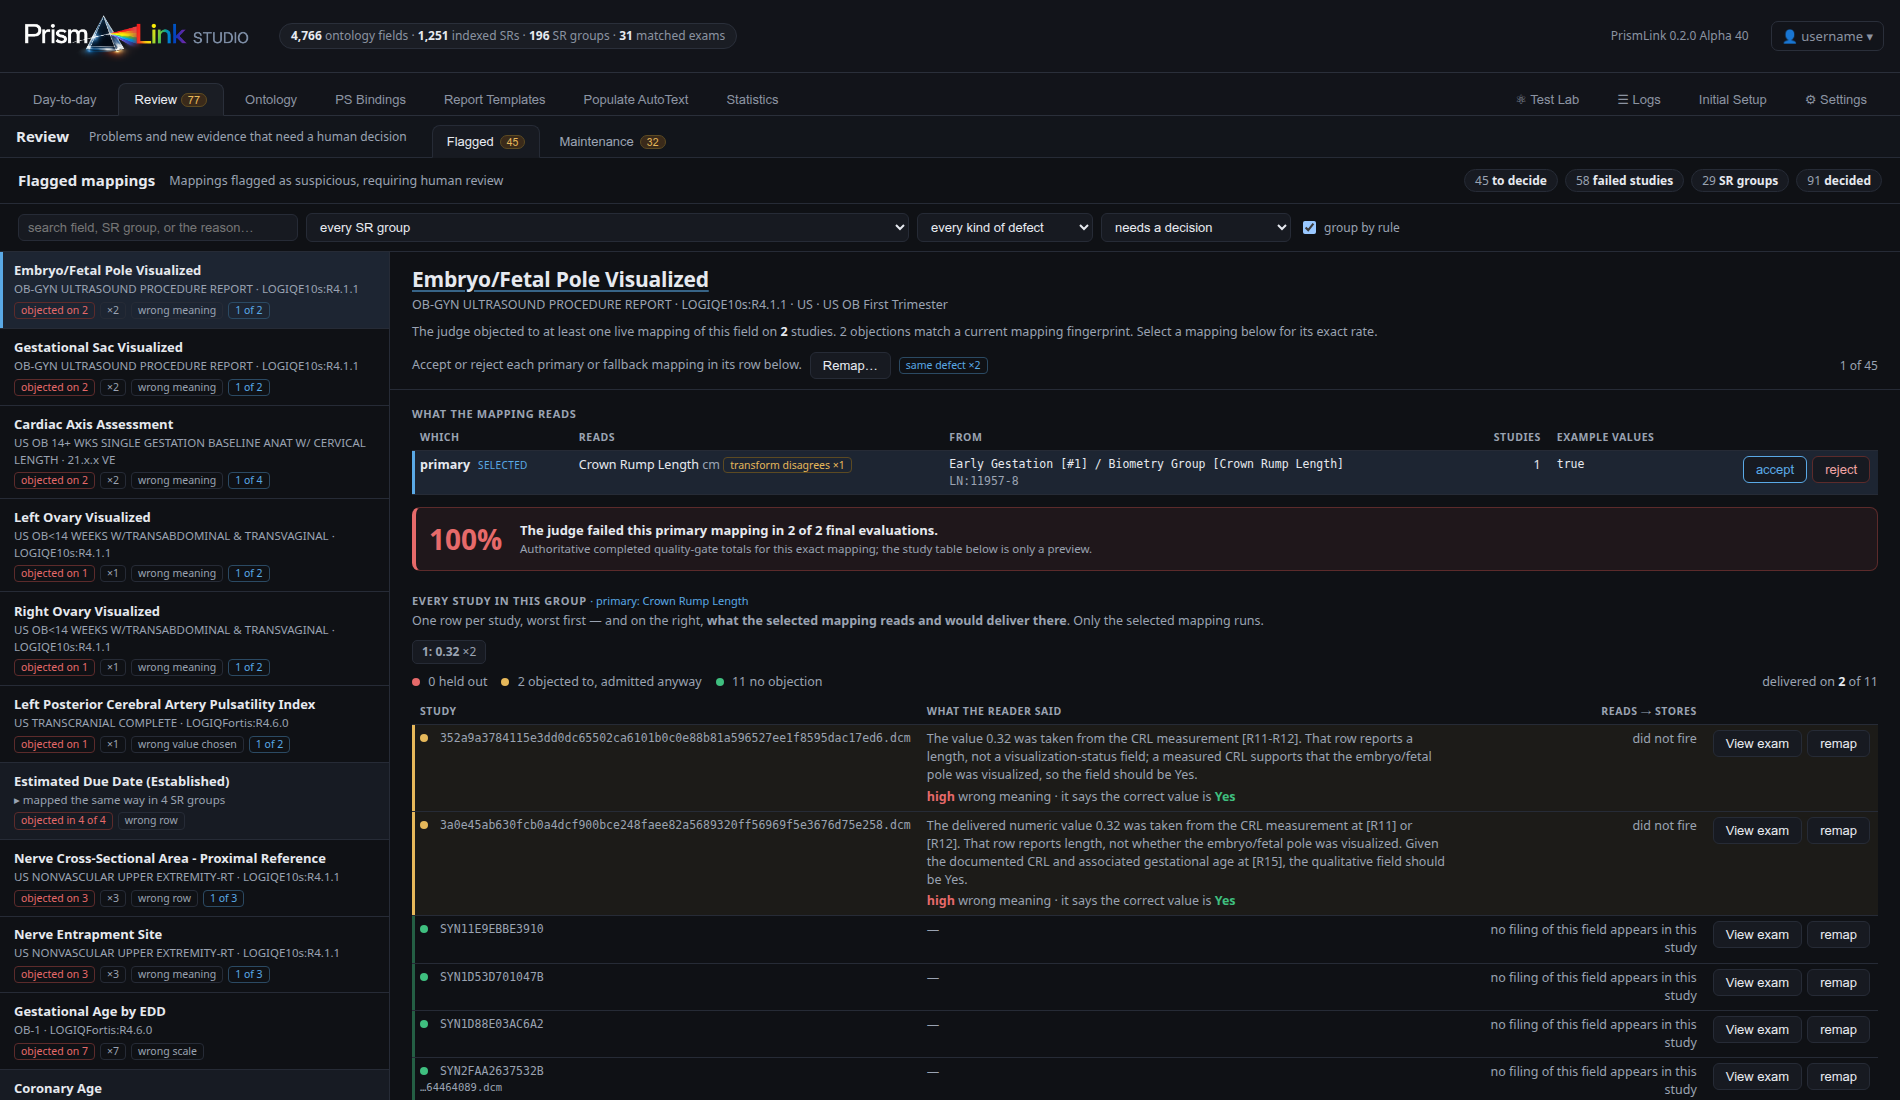
After go-live, a maintenance workspace surfaces change as it appears — newly detected report types, exam groups without a mapping, and structural changes in what a device sends — and routes each finding to the workflow that resolves it. A reviewer can acknowledge a condition without mapping it; if the underlying situation later changes, the condition reopens on its own.
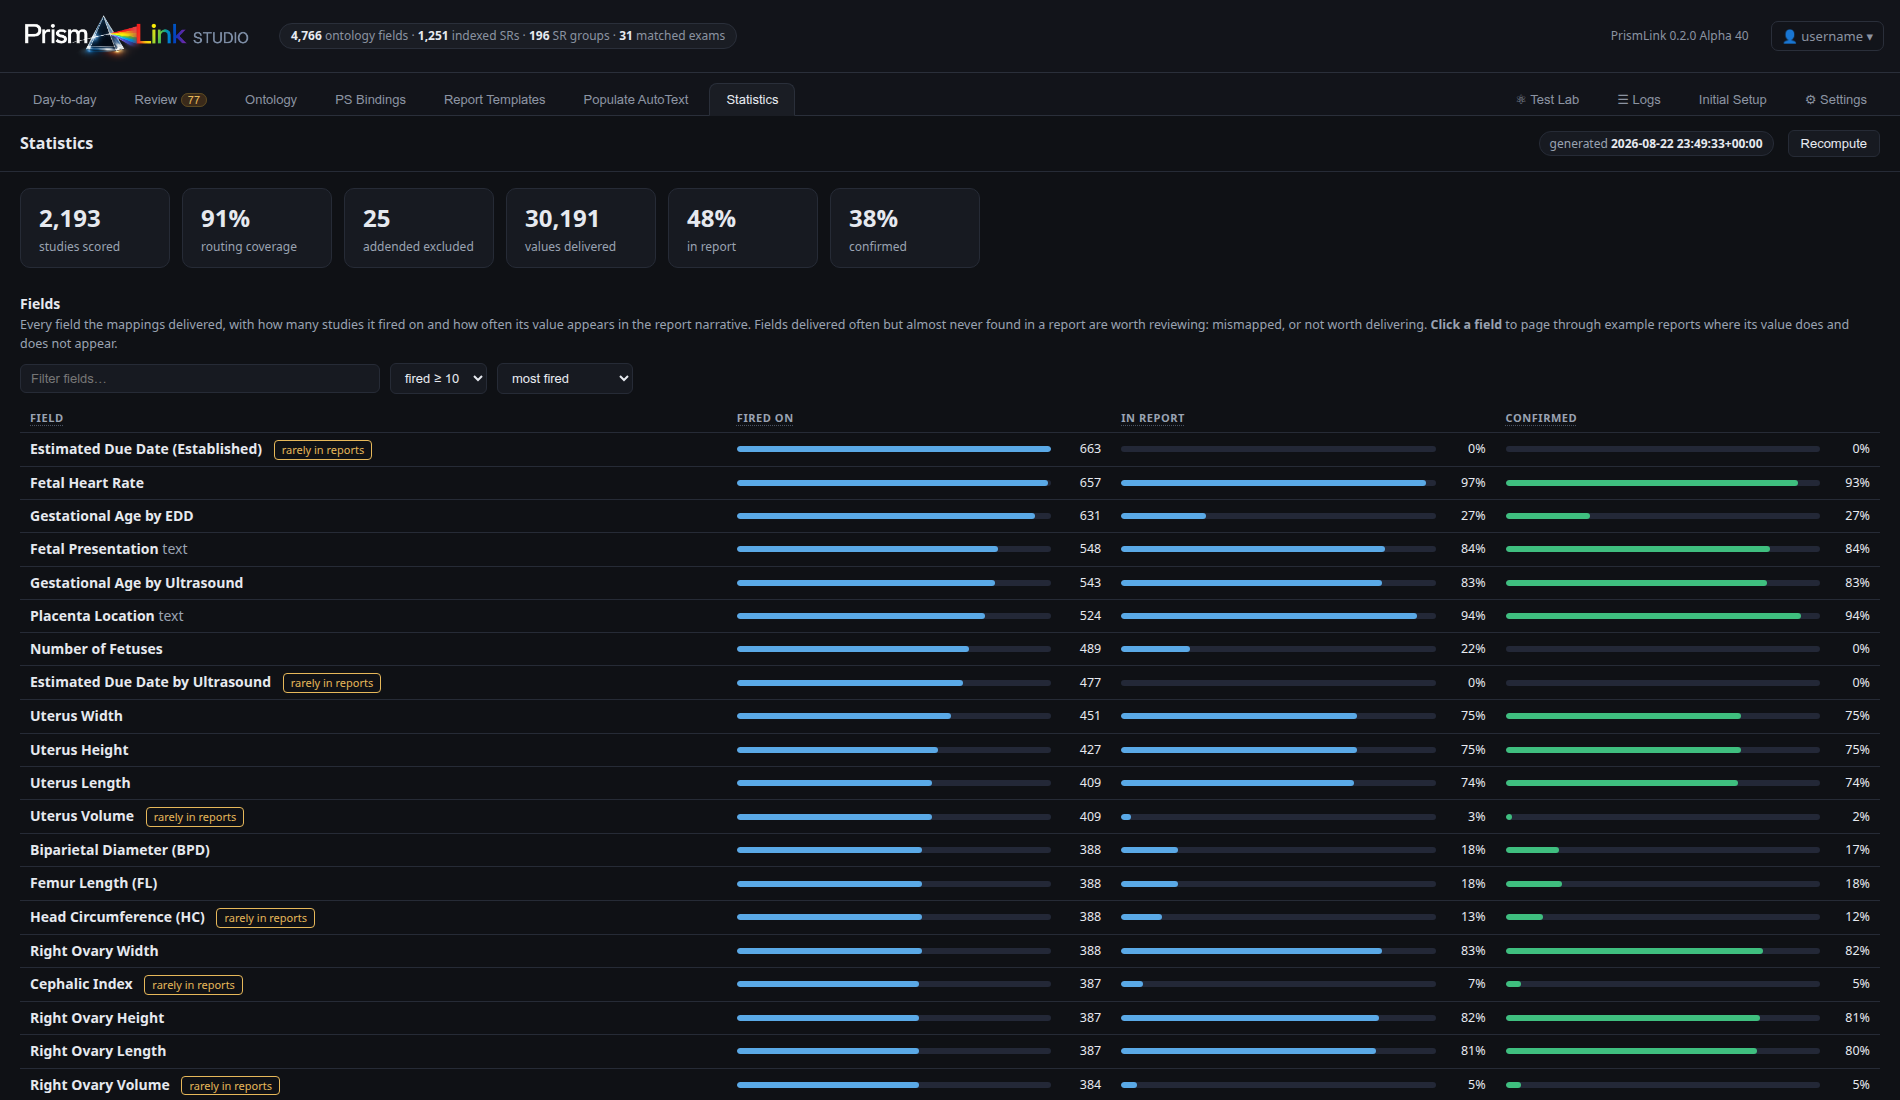
Once finalized reports are available, Statistics compares every delivered value against the signed report for the same study: how often each field fired, how often its value appears in the narrative, and how often the two agree. Fields that are delivered often but rarely reach a report stand out for review.
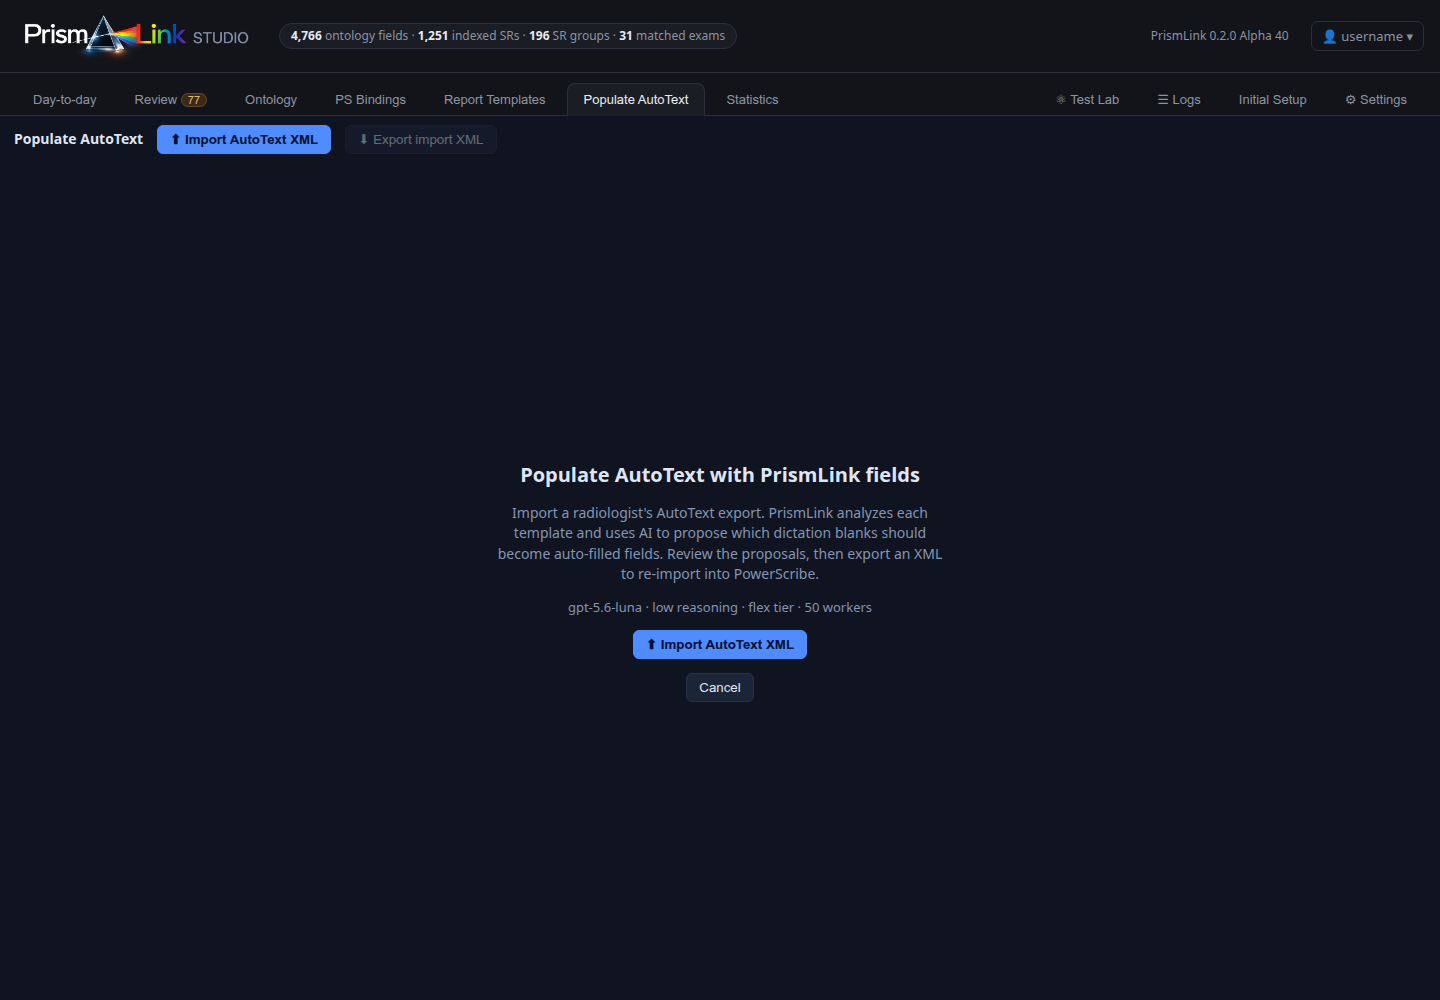
Existing AutoText templates can be brought across rather than rebuilt: import the reporting system's AutoText export, and PrismLink proposes where its fields belong in each template for a person to accept, then exports the result back for import.
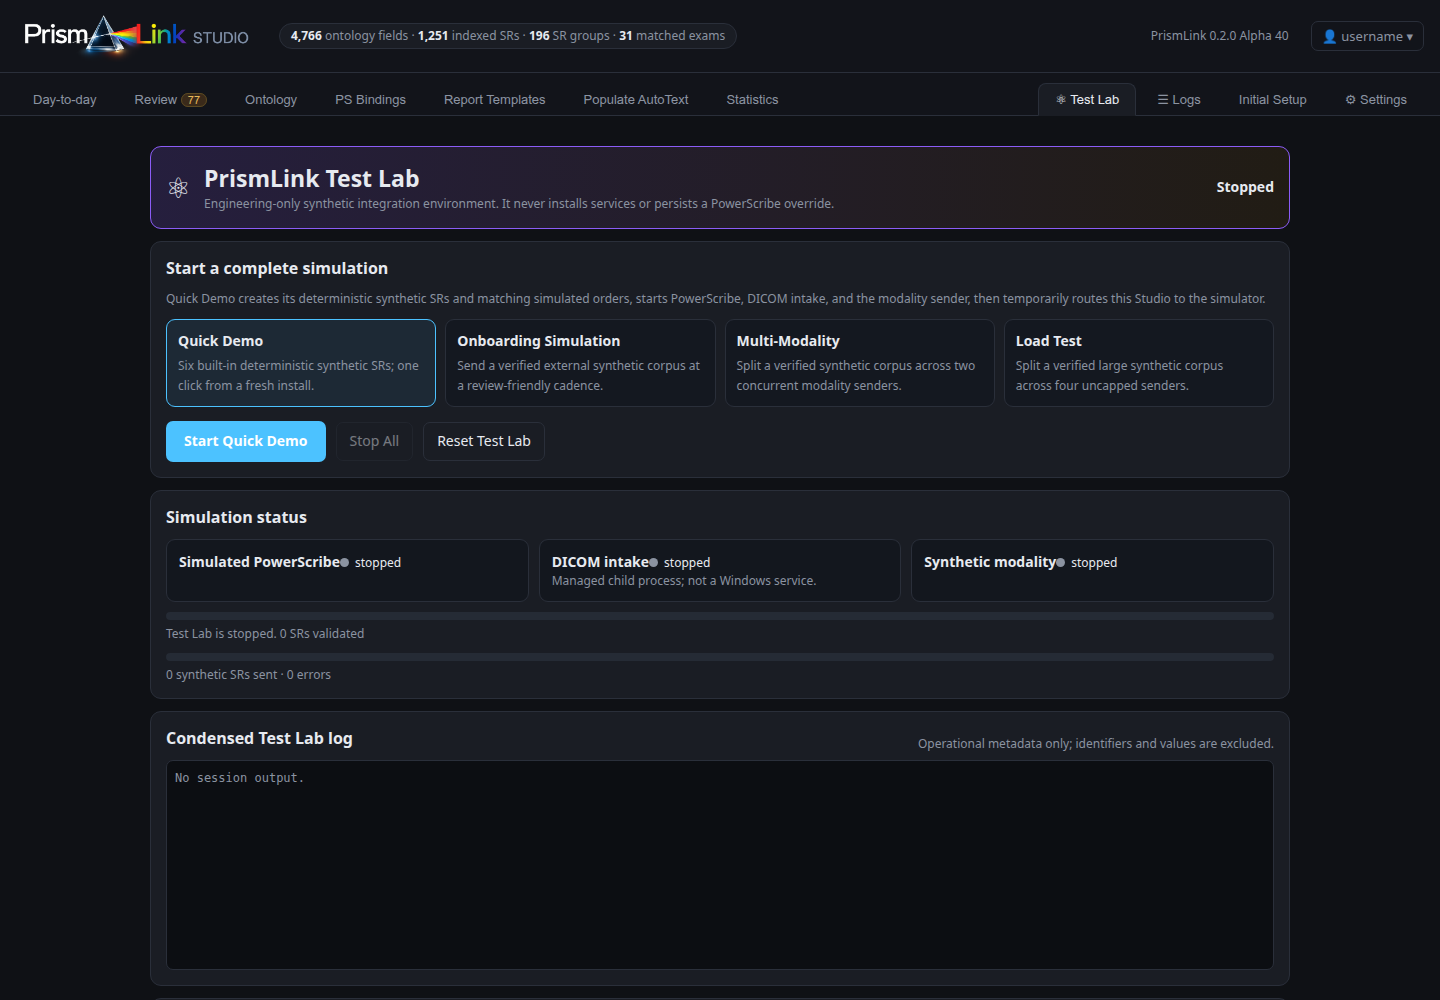
A built-in Test Lab exercises the whole path end to end using synthetic studies: a one-click demonstration, plus multi-modality and load scenarios, against a simulated scanner and a simulated reporting system. It runs only on non-production installations, verifies that every study it sends is synthetic before transmitting it, and never modifies real reporting-system settings.
Sites replacing an existing structured-data integration (for example, Hyland ModLink) can migrate rather than start over: PrismLink imports the outgoing system's configuration as a starting point, compares its own output against the outgoing system's on real studies, and transfers ownership field by field — without a coverage gap at cutover.
Deployment and data handling
- On-premises. PrismLink runs on hospital-controlled infrastructure inside the network, alongside the imaging and reporting systems. Studies are received, stored and processed locally.
- Isolated services. On Windows, PrismLink runs as four separate services — one receives DICOM, one receives HL7, one processes studies, and one delivers to the reporting system — each with its own restricted Windows account and access only to what its job requires. Only the delivery service can read the reporting-system password. The services are installed switched off and turned on deliberately by an administrator.
- Deterministic runtime. Live study processing is performed entirely by audited local code. No external service is contacted to deliver a study.
- AI-assisted configuration. During setup, PrismLink can use an AI model to propose how a device's encoding maps to the field ontology. Those proposals are reviewed and accepted by a person before they take effect, and the accepted mapping is then executed deterministically. This configuration step is the only point at which study content may be sent to an external AI provider. Everything sent passes through one control point that removes known patient-identifier fields first, sends only to providers the site has approved, never switches providers silently, and records an audit entry — without the content — for every request. A site can also switch external AI off entirely and configure mappings by hand.
- Self-contained installation. The Windows installer carries everything it needs and downloads nothing onto the hospital machine. Every component inside it is verified against fingerprints fixed when the installer was built.
- Signed updates. Software updates are cryptographically signed and verified against a public key pinned at installation. The distribution server is treated as untrusted: an update is verified before it is extracted, and again before it is installed.
PrismLink processes protected health information on behalf of the operating facility. Deployment, access control and data-retention arrangements are agreed per site. Please get in touch for the current technical and security documentation, or see the Security overview.